Shopping Habits Dynamics – Fall 2026 Bulgaria
Consumers haven’t stopped shopping. However, they are becoming increasingly selective about what they put in their baskets, how often they visit stores, and which offers are truly worth it. Data from a nationally representative study on consumer habits conducted in September 2026 reveals a market where economic uncertainty is being felt ever more keenly; promotions remain significant, and the value of a purchase has become a key factor in the decision-making process.
For manufacturers and retailers, this implies one thing: simply offering a product or a discount is no longer enough. It is essential to demonstrate why a purchase is worth making.
Economic Pressure Has Become Part of Daily Shopping
Three-quarters (76%) of respondents state that the economic situation influences the way they shop—up from 66% in 2025. For 42%, this impact is definitive, while another 33% indicate that the new economic realities are indeed altering their behavior.
Compared to the previous year, there has been an increase not only in the total share of affected consumers but also in the proportion of those who feel this impact more acutely. This signals that careful management of the household budget is no longer a practice limited solely to the most price-sensitive shoppers. The message is clear: price remains a key factor, but the purchasing decision also hinges on the perceived value. Consumers need to understand what they are getting for their money and why a specific product is the right choice.
A larger bill, but not necessarily more goods
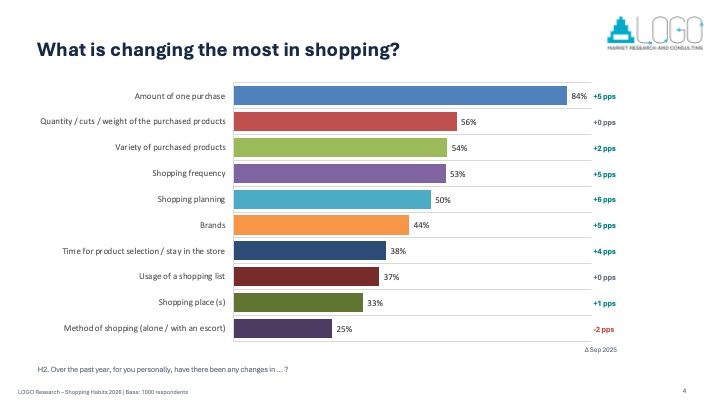
Adjusting the total amount spent per shopping trip is one of the most common consumer responses. In September 2026, 84% of consumers reported changing the amount they spend when shopping—up from 79% a year earlier.
In this context, a higher total reflects not only price changes but also the specific selection of goods—the composition of the shopping basket.
This combination illustrates why the average receipt value should not be viewed in isolation. It must be analyzed alongside the number of items purchased, the quantities, the product categories, and the frequency of store visits.
Consumers are planning more and shopping with greater purpose
These changes go beyond the total cost of a purchase; they also affect how people organize their shopping.
Compared to September 2025, the share of consumers who report changing how they plan their purchases has risen from 44% to 50%. There has also been an increase in the number of people using a shopping list—from 32% to 37%.
The frequency of shopping trips is also shifting: the proportion of people reporting a change in this regard has increased from 48% to 53%. Among consumers who have changed their shopping frequency, 81% state that they shop less often.
These findings point to a more deliberate approach to organizing purchases and a drive to use one’s budget more efficiently.
Furthermore, among those who have altered their product choices, 81% are focusing on essentials. Consequently, staple goods take priority, while unplanned purchases are more easily discarded.
For retailers, this makes the visibility of essential products, clear price labeling, and easy store navigation even more critical. For manufacturers, positioning a product as useful—and worth the cost—becomes a significant competitive advantage.
Promotions remain powerful, but trust also drives sales.
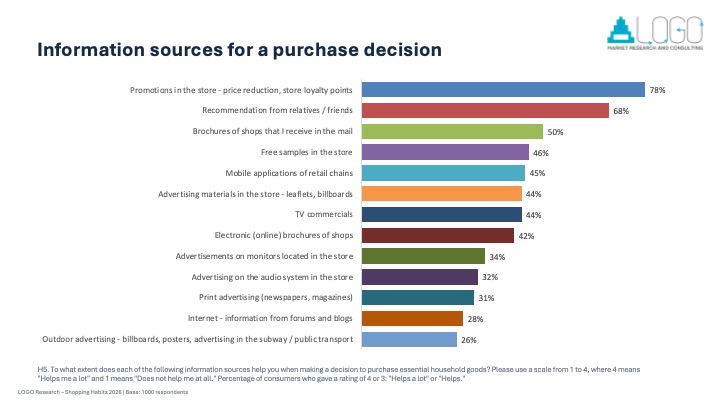
Promotional offers continue to be one of the most useful sources of information for shoppers. However, the data indicates that consumers also rely on other cues when making decisions.
Paper leaflets reach the home—but not always the shopping basket.
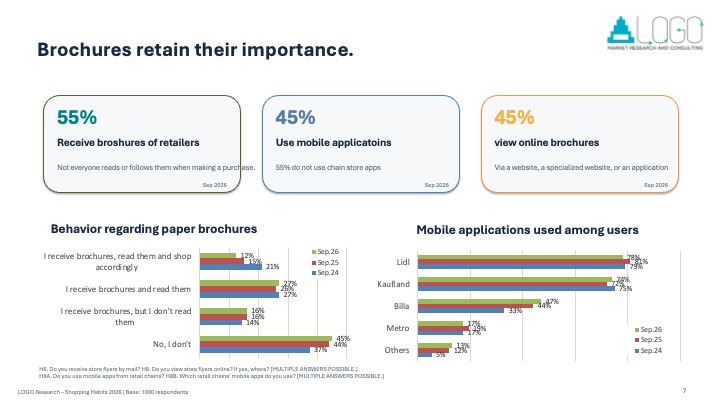
Paper leaflets remain a part of consumers’ daily lives; 55% of respondents report receiving such materials. Yet, receiving them does not equate to actually using them.
The data reveals a gap between the reach of this channel and its ability to drive a purchase. Only 12% of all respondents state that they read the leaflets and shop based on them, while 16% receive the materials but do not read them. Digital channels also maintain a significant presence: 45% of consumers view online brochures, while 45% use retail chain apps.
For the retail sector, the future lies in integrating these channels—ensuring that brochures, apps, in-store offers, and loyalty programs function as a cohesive, seamless experience. A digital channel adds value not merely by existing, but by helping the customer discover relevant offers and ultimately perceive their purchase as a successful one.
Staple foods retain their leading role
When asked about the type of food they choose, the largest share of respondents—76%—point to raw ingredients. Semi-prepared foods account for 14%, frozen foods for 7%, and canned goods for 3%.
This clearly highlights the dominant position of raw ingredients in consumer responses. For manufacturers and retailers, this finding serves as a starting point for analyzing their product assortment; however, it does not, in itself, prove that consumers have shifted to cheaper categories or that the demand for ready-to-use solutions is declining.
The results suggest several practical courses of action.
For manufacturers:
• Develop a clear pricing architecture that includes affordable options, staple products, and value-added variants.
• Test different pack sizes while ensuring the price per unit of measurement is clearly displayed. While a smaller package may lower the initial cost, it should not mask a higher unit price.
• Communicate specific benefits—such as quality, ingredients, origin, and practical usage—rather than relying solely on discounts.
• Measure the impact of promotions on repeat purchases, volume, and margins, rather than focusing exclusively on short-term sales.
• Use targeted testing to determine which messages and product features are most compelling for different consumer segments.
For retailers:
• Make promotional terms and final prices easy to understand and compare.
• Offer solutions for planned shopping—for example, bundles of essential products or deals on frequently purchased items.
• Integrate paper leaflets, online catalogs, and mobile apps into a unified communication strategy.
• Reduce barriers to using apps and loyalty programs.
• Measure the actual incremental impact of campaigns: changes in sales volume, average basket size, margins, and repeat purchases.
• Leverage the strengths of different store formats—from the convenience of a neighborhood shop to the extensive assortment of a large chain.
Proven Value: The New Competitive Advantage
Data from September 2026 reflects a transformed consumer landscape: shoppers are increasingly mindful of the economic climate, planning their purchases more carefully, and prioritizing essentials. At the same time, promotions remain significant, and recommendations from friends and family underscore that trust continues to play a vital role.
In such an environment, the winning strategy is not necessarily about offering the deepest discount. A more sustainable advantage belongs to the manufacturer or retailer that most clearly demonstrates the value delivered to the consumer, simplifies the planning of purchases, and succeeds in transforming a one-time promotional purchase into a lasting preference.
Source and methodological note: A nationally representative study by LOGO Research, conducted in September (2024, 2025, and 2026); data collection method: face-to-face personal interviews; sample size N=1,000 for each of the analyzed waves.

Wine Report 2026 Bulgaria
We are delighted to announce the release of our latest update of the “WINE REPORT 2026 BULGARIA”, produced by LOGO Research.
This comprehensive report offers a detailed analysis of the current trends, market dynamics, and consumer preferences shaping the wine industry in Bulgaria. Our team of expert researchers has conducted thorough market research and analysis to provide valuable insights into the factors driving the wine consumption patterns.
Key highlights of the report include:
- Alcohol Beverages Consumption
- Main categories overlap
- Wine quality assessment and sources of information
- Importance of origin
- Frequency and Weight, Place of Purchase, Prices
- Future trends
Whether you are a wine producer, distributor, retailer, or industry stakeholder, this report serves as an invaluable resource for understanding the evolving landscape of wine consumption in Bulgaria and identifying growth opportunities within the market.
You can download the detailed report here:

Retail Price Intelligence
In today’s market, pricing is no longer just a commercial lever — it’s a direct signal of consumer confidence, competitive pressure, and future demand.
That’s why we developed our latest Retail Price Intelligence Report for Bulgaria: a comprehensive view of how prices, promotions, and shopper sentiment are evolving in real time. Built on over 226 million observed prices across the Bulgarian retail market between October 2025 and March 2026, this report gives businesses a sharper lens on what is happening now — and what is likely to happen next. On top of that we are analyzing the available price data on daily basis going forward.
Download the report content from the following link.
Why this report matters
1. Understand real market price movements — beyond official inflation
. Our Retail Price Index tracks actual shelf-price changes across key FMCG categories including staples, dairy, meat, beverages, hygiene, and pharmacy.This allows you to:
* detect fast-rising categories before they impact margins,
* identify stable categories suitable for pricing defense,
* benchmark your pricing against broader market shifts.
2. Decode consumer behavior before it hits sales
. Consumer confidence in Bulgaria remains negative (CCI: -24.1), with the biggest concern tied to expectations about the country’s economic outlook and future household finances. This has a direct impact on:
* basket sensitivity,
* willingness to trade up,
* major purchase intentions.
Our report connects sentiment indicators with real retail pricing behavior — helping you anticipate shifts in demand rather than react too late.
3. Optimize promotional strategy with precision
. Promotions are widespread, but not equally effective.
The report reveals:
* which categories are most promotion-driven,
* where discount depth is strongest,
* where margin is being eroded unnecessarily,
* how your promo intensity compares with market norms.
This helps commercial teams balance traffic generation with profitability.
4. Benchmark retailer strategy and competitive positioning. We analyze:
· pricing levels by leading retailers,
· promo intensity,
· price dispersion,
· regional pricing gaps,
· competitive strategy clusters.
You’ll gain a clearer picture of who is competing on price, who is using promotions strategically, and where whitespace opportunities exist.
5. Prepare for upcoming market pressure with:
· continued inflation uncertainty,
· cautious household sentiment,
· euro adoption expectations influencing price perceptions,
businesses that rely on historical assumptions risk falling behind. The report provides forward-looking signals to support:
* pricing decisions,
* category planning,
* promotional calendars,
* regional strategy.
Who benefits most?
This report is especially valuable for:
* FMCG manufacturers
* retail chains
* pricing and revenue management teams
* category managers
* market intelligence teams
* investors tracking consumer sectors
If your business needs clearer visibility into price dynamics, shopper sensitivity, and competitor behavior, this report can become a practical decision-making tool — not just another market snapshot.
We will be happy to collaborate based on the report valuable insights, the in-depth information from the specilized dashboard or to guide you thru the customized data requests of any time period, itemization and key indicators.
You can request our proposal and more details here:
Your LOGO Research team

